

- Read rates in this sector have improved steadily over the last six quarters, both quarter to quarter, and year-over-year.
- Spam rate trends have been variable, but improved for the first three quarters of 2018, and for the second quarter of 2019.
The seventh in our performance benchmark series covers B2B marketing email. This analysis includes eight key industry sectors we classify in this space. We analyzed promotional email over a two-year period for about 900 related brands we track in these eight sectors. (These sectors and additional methodology details are in the footnote below.)
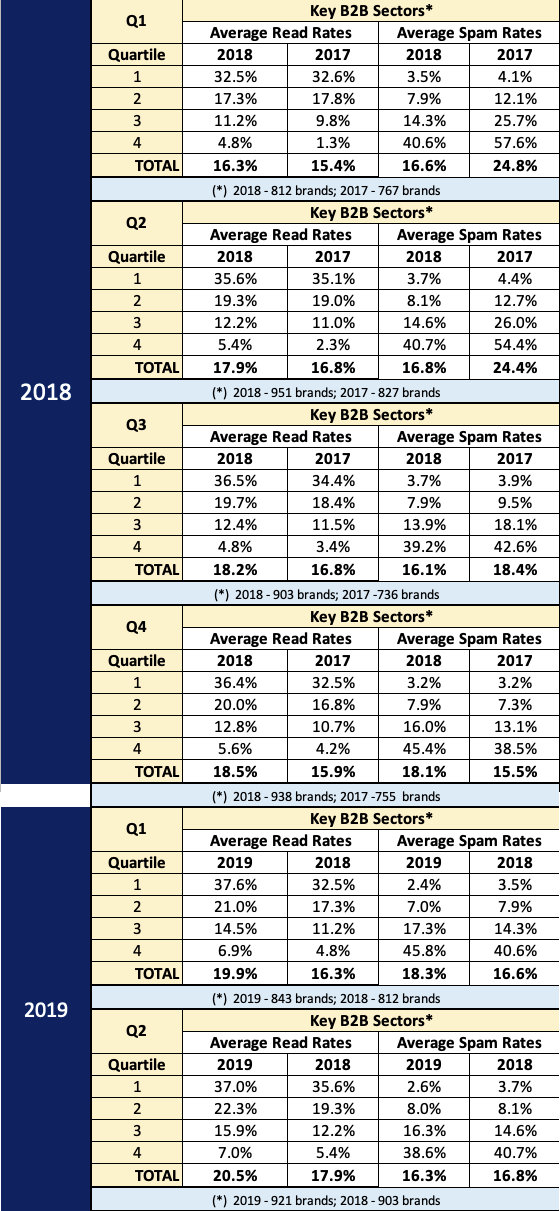
The tables to the left show overall read rate and inbox performance ranked best-to-worst by quartile for each quarter of 2018 and 2017, and for the first two quarters of 2019. Ranked quartiles are better than simple averages at showing the range of performance across the group.
Highlights Below:
- Average read rates run from a high of 37.6% for brands in the top-ranked quartile for that metric (Q1 2019), down to 1.3% in the bottom quartile (Q1 2018). Notably, as compared to other industry categories we’ve recently benchmarked, B2B read rates tend to be somewhat higher, possibly because audience engagement may be professionally compelled to some degree.
- Spam rates range from 2.4% for brands in the top quartile for that metric (Q1 2019), up to more than 57.6% in the bottom quartile (Q1 2017). Spam rates consistently average in the 50-80% range for the two worst performing quartiles — half the tracked brands. Diagnosing and remediating issues causing such weak performance would have an enormously positive business impact.
- Quarter-to quarter trends: Overall read rate performance improves consistently over all six quarters analyzed. Overall spam rates deteriorate slightly over the first two quarters of 2018, improve somewhat in Q3, worsen again over the next two quarters, and then show dramatic improvement in Q2 of 2019.
- Year-over-year trends: Overall average read rates improved YOY for each of the six quarters in this analysis. Those trends are also reflected in each of the quartiles shown. Overall spam rates improved dramatically during the first two quarters of 2018, and again — though less strongly — in Q3. The next two quarters show deterioration, followed by a slight improvement for Q2 of 2019.
Benchmark data help set a standard for evaluating your own performance. If you’re sending marketing email in the B2B space, and your activity underperforms the best performance averages shown here, you may find considerable revenue and retention upside in identifying opportunities to replace, restructure or eliminate underperforming programs, and/or to remedy send practices that drive poor inbox performance. Not addressing these opportunities is leaving money on the table.
Note on Methodology: B2B industry sectors reflected in this category are: Advertising, Marketing and P.R.; Architecture and Engineering; Business Services; Enterprise Software; Gov’t and State Agencies; Industrial Goods and Manufacturing; Trade Shows and Conferences; Uniforms & Professional Wear. Included in this analysis were promotional (as opposed to transactional and administrative) emails for qualifying brands with a Projected Panel Reach of 100,000 or greater.